With the Time line controls, you can display past observation data,
or forecast data, up to 24 hours before or after the current time. The
Time line controls at the bottom of the view include the time slider button
![]() and the Current
Time button.
and the Current
Time button.
You can use the Time line controls to display:
Current observed data.
Past observed data 24 hours before the current time.
Forecast data for 24 hours after the current data, when available.
Archived data, including past data 24 hours before the selected archived time and forecast data 24 hours from the archived time onwards.
In Map View only: Playback animated data, such as radar image and thermal map data development.
The data will be displayed in the Station Summary View and the Map View.
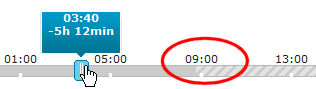
TIP: To see short descriptions, move the mouse pointer over different parts of the picture:

The text on top of the time slider button shows:
Time of observations, or time of forecast.
How much the displayed time differs from the current time, for example, "-13h 10 min".
In archive mode: How much the displayed time differs from the selected archive time.
"Now", when at current time.
In archive mode: "Archive time" when at the selected archive time.
When past or future time is selected with the time slider, the current
time is indicated by the change of the time line color:
For more information, see topic Using Time Line Controls.
See also: