In the Graph tab of the Stations View, the selected parameter will be displayed as a graph line in a new tab. For instructions on selecting the parameters, see topic Graph Tab Basics.
The small icons in the tabs indicate the line colors of the graphs (Legend):
![]()
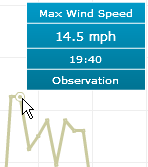
Move the mouse pointer along the active graph line to view the time and measurement values. The last line in the tooltip indicates whether the values are observed values (Observation) or forecast values (Forecast).
NOTE:
The details are displayed only for the active graph
line. If the details are not shown, select the corresponding tab first.
Click the Close icon ![]() that
is displayed when you move the mouse pointer over the tab:
that
is displayed when you move the mouse pointer over the tab:
![]()
You can add the graph again at any time using the Add icon ![]() .
.
See also: