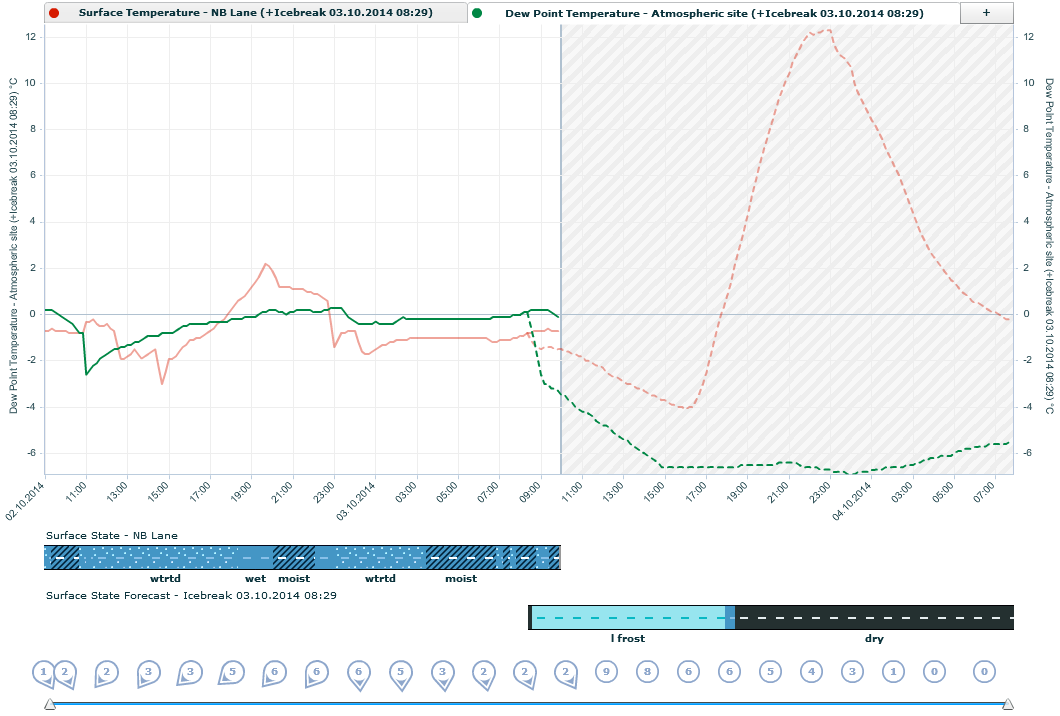
The Graph tab in the Stations view displays the following for a single station:
Weather observations in graphical format as graph lines.
Road surface state, or other states, as state icons below the graph.
If configured and available, Automatic Vehicle Location (AVL) data.
When available, forecast data can also be displayed. See topic Using Time Line Controls.
TIP: To see short descriptions, move the mouse pointer over different parts of the picture:
Click the Stations tab in the application toolbar.
Select the station in the side panel.
If the selection panel is not displayed, click the arrow icon on the
left:
![]()
When the selected station is displayed click the Graph tab at the top of the Stations View.
NOTE: These pages list some typical options and selections, for example, for the parameters available for selection or the displayed states. You may have different options available.
NOTE: The following describes the graph functionality with Adobe Flash player. If your browser does not support Flash (or Flash is disabled) an HTML graph is displayed instead. In the HTML graph you can select from a set of predefined parameter selections.
Click the Add icon ![]() at the upper right corner of the graph tab.
at the upper right corner of the graph tab.
Select an item from the list, for example, weather parameter, road or rain state, or forecast.
See also: