In the Graph tab of the Stations View, if the selected item is a state, for example, road surface state or rain state, the state is indicated with icons and text below the graphs.
![]()
For instructions on selecting the parameters, see topic Graph Tab Basics.
The road weather station used and the forecast provider determine which road surface states are displayed in your system.
The system enables displaying the following observed road surface states (examples):
inval = Invalid
unkwn = Unknown
short = Road surface sensor not in operation
slushy = Road surface is slushy
dry = Road surface is dry
moist = Road surface is moist
wet = Liquid water on the road surface
wtrtd = Liquid water containing de-icing chemical on the road surface
frost = Frost on the road surface
snow = Snow on the road surface
ice = Ice on the road surface
trace = trace (of residual de-icer)
alert = alert
crit = critical
absor = absorption
dew = dew
abdwp = absorption at dewpoint
fadwp = frost at dew point
prdry = probable drying
The system enables displaying the following forecast road surface states (examples):
uknwn = unknown
dry = dry
wet = wet (no precipitation)
precip wet = wet (with precipitation)
l dew = light dew
h dew = heavy dew
l frost = light frost
h frost = heavy frost
ice = ice
snow = snow
sleet = sleet
hail = hail
damp = damp
frost = frost
frz rain = freezing rain
Wind direction
and wind speed average are indicated with icons at the bottom of the Graph
tab:
![]()
Rain state is indicated with icons and text below the graphs:
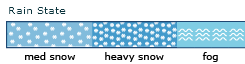
The following rain states can be displayed:
None
Light rain
Med rain (medium rain)
Heavy rain
Light snow
Med snow (medium snow)
Heavy snow
Fog
Cloud type is indicated with icons and text below the graphs:
![]()
The following cloud types can be displayed:
None
Low cloud
Med cloud (medium level clouds)
High cloud
Click the Close icon ![]() that
is displayed when you move the mouse pointer over the state name label:
that
is displayed when you move the mouse pointer over the state name label:
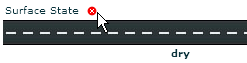
You can add the state icons again at any time using the Add icon ![]() .
.
See also: