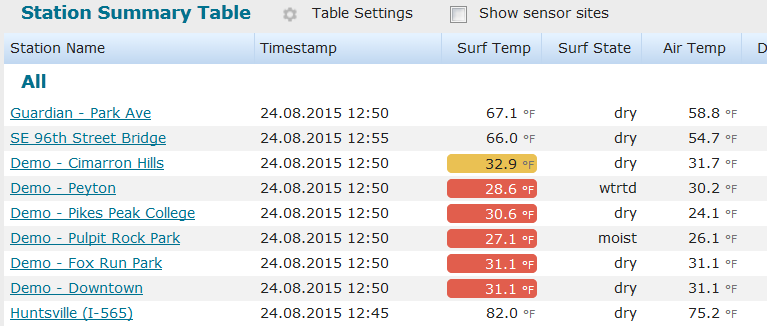
The Station Summary View displays the weather observations in table format.
To show the Station Summary View, click the Station Summary button in the application toolbar.
Table cells are highlighted with different colors based on the road conditions, if selected in table settings.
By default, the data displayed is current data. However, you can use the Time Line controls to view also past observation data or forecast data. For more information, see topic Using Time Line Controls.
You can also view archived data, refer to topic Archived Data.
NOTE: When viewing Forecast data:
Only the data provided by your forecast provider will be displayed. The data set displayed in forecasts typically differs from the observation data set.
Some stations will not be displayed at all if there are no forecasts available.
For past and current observations, the following data statuses are displayed:
If the values in the columns are grey, the most recent data from that station is older than 1 hour 15 minutes.
Empty column means there is no sensor for that parameter in the station.
For changing what is displayed in the table, and if colors are used, refer to topic Editing Table Settings.
See also: