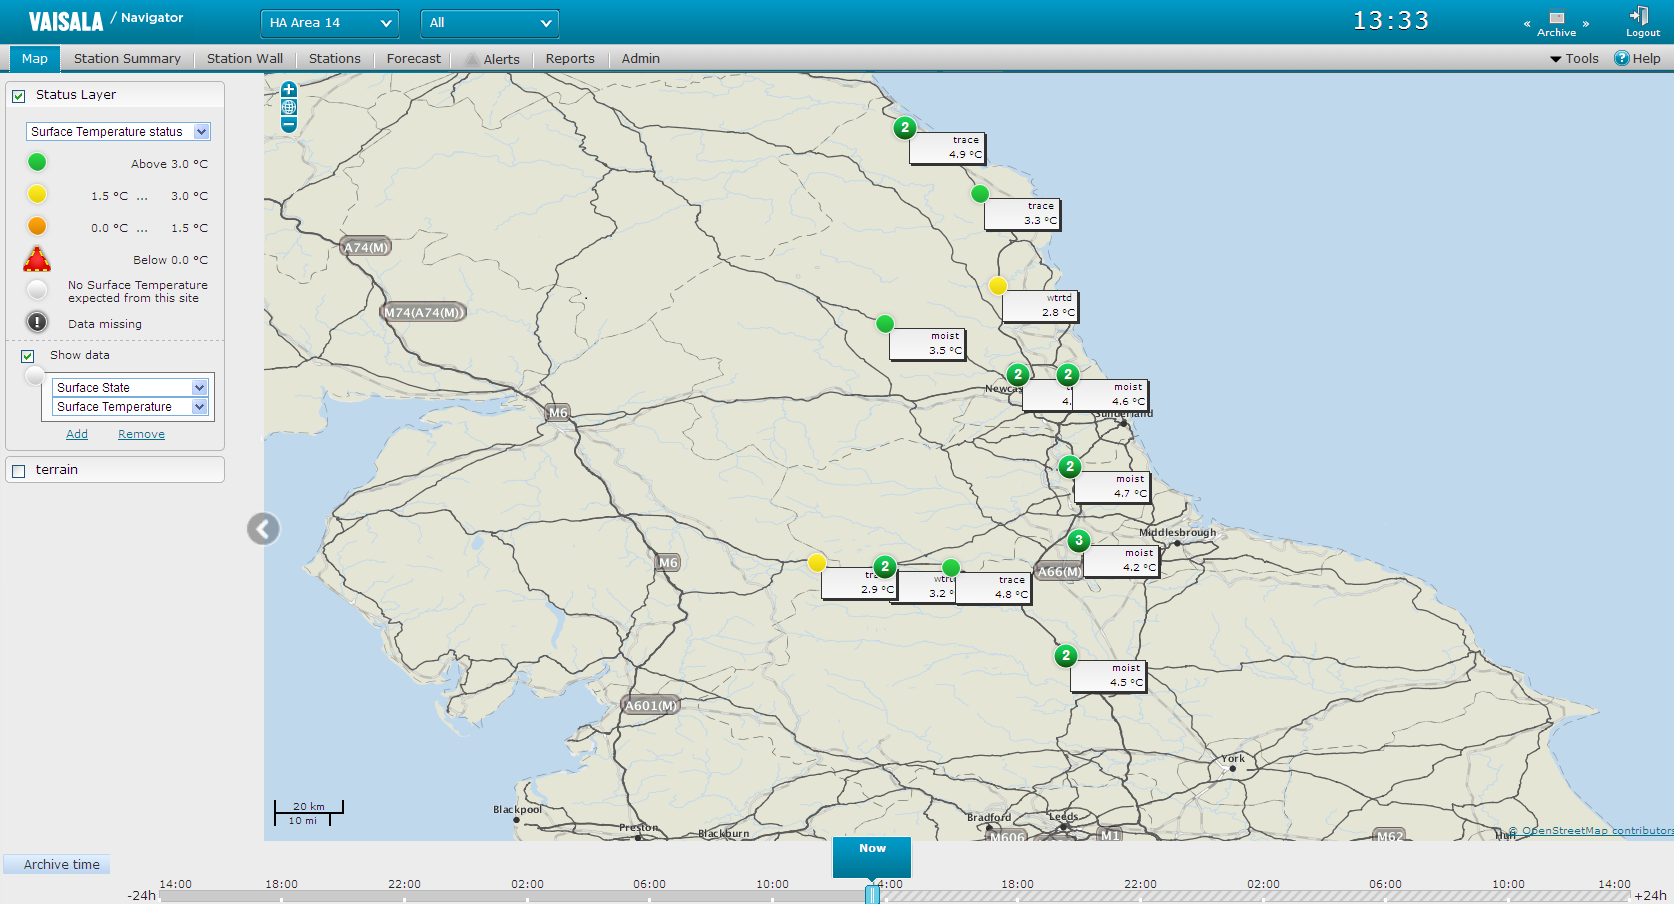
The Map View displays a map with the selected information layers, from the selected set of stations.
To show the Map View, click the Map button in the application toolbar.
TIP: To see short descriptions, move the mouse pointer over different parts of the picture:
The number and type of available layers differ dynamically and each layer appears as an option only when data is expected or present. See topic Map Layers Basics.
By default, the data displayed is current data. However, by using the Time line controls, you can choose to display past observation data or forecast data up to 24 hours before or after the current time. For more information, see topic Using Time Line Controls.
NOTE: Alarm status is displayed correctly only in current time.
You can also view archived data, refer to topic Archived Data in the Map View.
You can also play back animated data, such as radar image and thermal map data development, refer to topic Using Time Line Controls.
NOTE: When viewing Forecast data:
Only the data provided by your forecast provider will be displayed. The data set displayed in forecasts typically differs from the observation data set.
If there is no forecast available for a station, the station will be displayed as grey.
See also: