Status Layer
The Status Layer of the Map View shows the road surface conditions at
the weather stations at a glance.
In the layer selection side panel, you can select which status is displayed
and adjust the way the layer looks.
Station Markers
The station markers indicate the selected status, for example,
Surface Temperature status. The legend in the side panel changes with
the selection. See Selecting
Parameters for Station Markers.
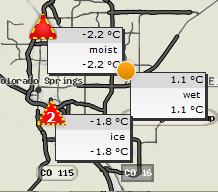
By toggling the Show data
option in the side panel, you can select:
To show the station markers and the selected
data from the stations. The first row of data is always related to
the selected status:
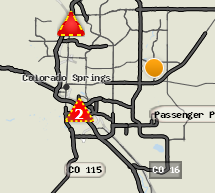
To show only the station markers. The station
markers indicate the selected status, for example, Surface Temperature
status, or Alarm Status:
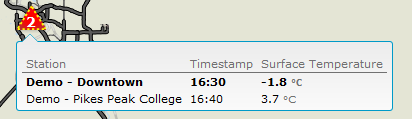
A tooltip shows the details from the station when you move the mouse
pointer over the station marker.
NOTE:
Alarm status is displayed
correctly only in current time.
If the station has active
alerts, the station marker contains the text "Alert". Open the
Alerts View to get more information
on the alerts.
Station Clusters
When the map is zoomed out, the stations are clustered together. One
station marker represents several stations that are located near to each
other.
In the layer selection side panel, you can select which parameters and/or
camera image are displayed with the station markers by doing the following:
Select
the Show data option
in the side panel.
Click
Add.
Click
the arrow to show the list of parameters and select one.
You can add up to four values. The parameters are displayed on the map
in the same order as in the list; the top-most value first.
To remove values, click Remove.
The last value in the list will be removed.
Multiple Surface Sensor Sites
If a station contains more than one surface sensor site, only one of
the sites is used for providing the values in the status layer. However,
when you move the mouse pointer over the station marker the values from
all available sensor sites are displayed in a tooltip.
Opening Stations Views
Double-click the station marker to open the Stations
View for that station.
NOTE:
For station markers that indicate station clusters,
zoom in first until the marker indicates only one station.
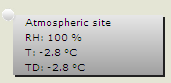
Markers for Other Sensor Sites
If configured in your system, the map may include markers for other
sensors in your area. Typically, you have to zoom in very close to see
them, for example, around airport runways.
These markers show a set of pre-configured parameters and typically
show the grey status color (No road surface temp expected from this site).
If the sensor provides road surface temperature, the colors indicate the
temperatures as in the normal station markers.
You can hide the data by clicking the station marker.
Map View Basics
Map Layers Basics
Zooming and
Moving the Map
Using Time Line
Controls
Application Parts